Temperature & Humidity Chamber may integrate inside cameras for surface inspection, insulation resistance monitoring, leakage current logging, and real-time voltage tracking. The goal is no longer simply determining whether a fail sample, but understanding when degradation begin and how it develops over time.
Humidity Damages Electronics More Quietly Than Heat
High temperature usually produce visible signs of stress. Plastics may discolor, adhesives soften, displays warp slightly, or housings begin to shrink after prolonged heating.
Humidity behave differently. Most damage progresses slowly and remain almost invisible during the early stages.
In modern electronic assemblies, moisture can gradually penetrate protective coatings, migrate into gaps around IC leads, or diffuse into the fiberglass layers inside the PCB. At first, the device appears completely normal. Electrical parameters remain stable, and no obvious symptoms are visible.
However, after repeated temperature-humidity cycles, subtle discoloration may begin forming around component leads. Copper pads slowly lose their metallic shine and turn dark yellow or dull brown. In high-power circuits, thin white oxidation residues may appear around solder joints or connector edges.
As degradation becomes more severe, moisture combined with electrical bias can trigger electrochemical corrosion. Under a microscope, extremely small metallic dendrites may form between IC pins, resembling tiny spiderweb-like structures. Over time, these conductive paths grow until they cause leakage current, intermittent short circuits, or unstable signal behavior.
One important detail is that many failures do not appear during the actual test itself.
A sample may continue operating normally at 85°C and 85%RH. But after several hours removal from the chamber, random resets, abnormal standby current, or RF instability may suddenly appear. This often occurs when condensed moisture accumulates at regions with temperature gradients and activates weaknesses that had already developed during testing.
For this reason, many reliability laboratories now monitor not only the high-temperature dwell period but also the recovery phase after testing.
The Chamber May Be Stable While the Material Is Still Absorbing Moisture
A common misconception is assuming that once the chamber reaches 85°C and 85%RH, the test sample has also reached equilibrium.
In reality, multilayer materials such as coated PCBs, lithium battery modules, molded epoxy structures, or engineering plastics may require much longer for moisture to diffuse deeply into their internal structure.
For example, with acrylic-coated PCBs, moisture during the first few hours mainly remains on the surface. Over extended exposure, the coating gradually absorbs water vapor, becoming slightly softer and losing adhesion strength around component edges.
Under magnification, the coating surface may change from transparent to slightly cloudy. Faint halo-like patterns can appear around IC leads, while coating edges may swell slightly, similar to moisture absorption in paint layers. In some areas, microscopic air bubbles begin forming beneath the coating.
In lithium battery modules or EV battery packs, prolonged humidity exposure may also reduce the elasticity of sealing materials around battery cells. At first, only slight discoloration appears along the seal edges. Later, fine hairline cracks may develop in corners exposed to thermal stress.
If the test duration is too short, many of these aging mechanisms may not yet become visible.
That is why even with the same temperature-humidity profile, simply changing the dwell time can produce dramatically different reliability results.
Airflow Inside the Climate Chamber Can Cause Uneven Aging
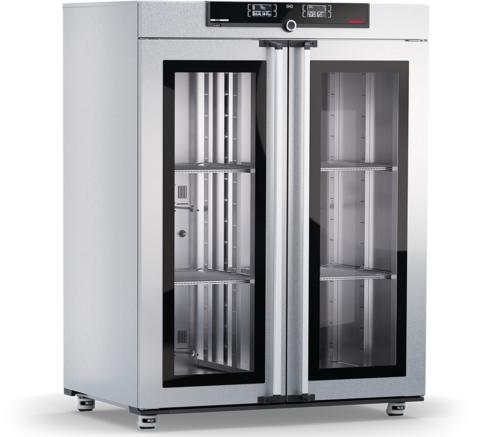
When evaluating a Temperature and Humidity Test Chamber, users often focus mainly on temperature range or thermal uniformity. However, in long-term aging tests, internal airflow distribution can directly affect how quickly materials degrade.
Samples placed near air outlets typically experience stronger heat and moisture exchange. Their surfaces heat up faster, while condensation and evaporation cycles occur more aggressively than in other chamber locations.
This effect is especially noticeable in high-power PCBs, LED modules, lithium batteries, and devices with large metal heat sinks.
During high-power LED module testing, two samples positioned differently inside the same chamber may show significantly different aging behavior. A sample located near the airflow outlet may experience faster yellowing of reflective surfaces, clouding of LED encapsulation silicone, or fine cracks forming in optical adhesives around the lens edges. Meanwhile, a sample positioned closer to the chamber center may still appear nearly unchanged.
This is one reason why many reliability laboratories now evaluate chamber uniformity under actual load conditions rather than testing the chamber empty.
Many Failures Begin During Temperature Transition Phases
When the Heating and Cooling Chamber ramps temperature rapidly under high humidity conditions, component surfaces may not immediately reach thermal equilibrium with the surrounding air. This can create an extremely thin layer of condensation on metal surfaces.
The moisture layer is often invisible to the naked eye. However, under angled lighting or macro imaging, engineers may observe a faint fog-like sheen on PCB surfaces, tiny reflective spots around connectors, or an ultra-thin condensation film briefly forming on sensor glass before disappearing.
Even a very small amount of moisture can generate leakage current in high-voltage circuits or accelerate corrosion around component leads.
In RF devices, sensors, or densely packed control boards, failures may not appear as complete breakdowns. Instead, they often emerge gradually through increased signal noise, unstable measurement drift, random resets, or intermittent malfunction during thermal cycling.
For this reason, many modern reliability tests no longer focus solely on whether a sample survives the test. Engineers now pay close attention to subtle changes that develop throughout both the temperature transition and post-test recovery stages.