
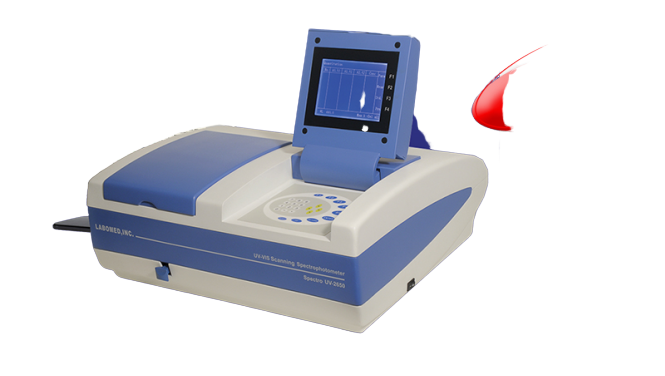
LABOMED UV-VIS Spectro UV-2650 Scanning Spectrophotometer
| - Wavelength range: | 190-1100nm |
| - Spectral Bandwidth: | 2nm. |
| - Wavelength Accuracy: | ±0.5nm |
| - Wavelength Reproducibility: | 0.2nm |
| - Photometric Accuracy: | ±0.5%T (0~100%T) ±0.002A (0~0.5A) ±0.004A (0.5A ~1A) |
| - Photometric Reproducibility: | 0.2%T |
| - Working Mode: | T,A,(-0.3-3A),C,E |
| - Stray Light: | ≤0.1%T(NaI,220nm;NaNO2,340nm) |
| - Baseline Flatness: | ±0.002A |
| - Stability: | ≤0.002A/h (at 500nm, after warming up) |
| - Noise: | ±0.001A (at 500nm, after warming up) |
| - Detector: | Silicon Photo-diode |
| - Display: | 6 inches high light blue LCD |
| - Power: | AC:220V/50Hz, 110V/60Hz,140W (Automatic) |
| - Dimensions: | 530x410x210mm |
| - Net Weight: | 18Kg. |
- 4 square optical cells 10mm.
- 2 square quartz cells 10 mm with lid
- Dust cover
- 1 Software
- 1 Software Manual
- 1 Instruction Manual
- 1 Power cable
- 1 PC cable
Software Specifications
Such operations as photometry measurement, spectrum measurement, quantitation measurement and kinetic measurement are offered in UV-Win Windows applications.
Multi-wavelengths photometric measurement at up to 10 wavelengths with the arithmetic calculation according to the user-entered formula.
Up to 10 spectra and time-course curves can be measured and recalled in memory with data-handling of arithmetic calculation, logarithmic calculation, reciprocal calculation, smooth, derivate (1st ~ 4th), Abs to/from %T conversion and peak pick.
Up to 24 standards can be entered and measured for the fit of calibration curve with order to 1st ~ 4th. Offered are the quantitation methods of single wavelength, two-wavelength, coefficient two-wavelength, three wavelength and 1st ~ 4th derivatives.
Kinetic measurement can monitor the changes of absorbance and transmittance against time course at 10 different wavelengths. This module allows flexibility in manipulation and data display.
With the Windows clipboard, the measured data and graphics can be copied to other applications software for reports. Also offered are filing functions, display functions, and others (such as auto file and repeat measure/scan etc.).
Get exclusive volume discounts, bulk pricing updates, and new product alerts delivered directly to your inbox.
By subscribing, you agree to our Terms of Service and Privacy Policy.
Direct access to our certified experts